


One thing we're going to keep doing at Capital Weather is continually develop new goodies as we move along. Two big ones were just added to the site:
- Maps of predicted precipitation. From the premier forecasters at the National Weather Service's Weather Prediction Center, the Forecast Lab now has maps for predicted precipitation amounts, as well as forecast totals for various periods like one to three days or one to seven days.
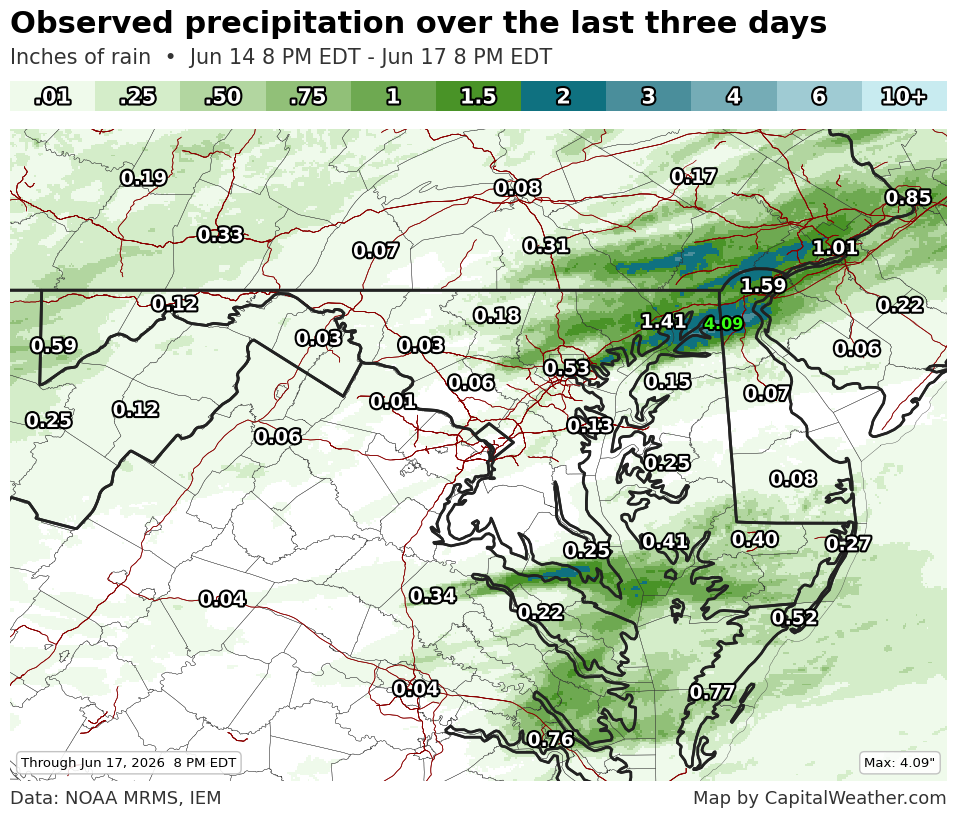
- Maps of observed precipitation. New maps in the Climate Room display how much rain has fallen, back to three days. The data originates from the National Severe Storms Laboratory and comes to us from the always amazing Iowa Environment Mesonet site. Coming soon: we'll be adding observed precipitation data going further back in time.
Since we launched CapitalWeather.com at the very end of May, some other additions and changes include:
- Dark mode. Most of the weather and climate widgets have been enabled for dark mode. Any not converted will soon be.
- Alert map and related items. Dan Stillman and I developed an alert map to accompany our alert widgets. Dan has also led development of our severe weather coverage widgets.
- Climate Room now includes many more locations. One supporter understandably requested we ditch airport acronyms (DCA, IAD and BWI) for actual names. While making this change, I added a bunch of additional locations, as far away as Salisbury and Hagerstown.
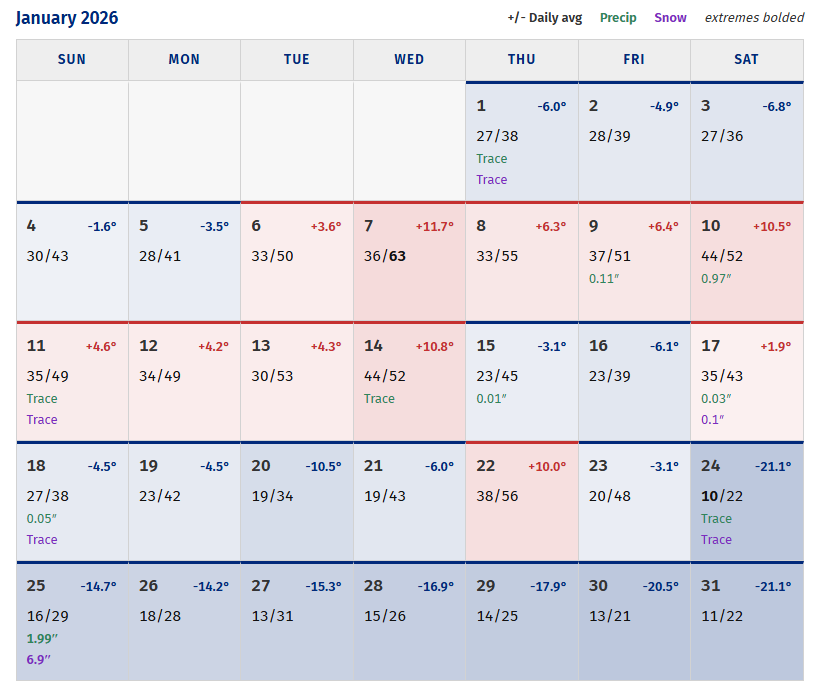
- Calendar view for monthly data summaries. Based on supporter feedback, I added a color-coded calendar to the Climate Room to summarize days that were warmer and cooler compared to normal, as well as precipitation information.
- Temperature differences from normal for each month over the last year. While writing a recap of May's weather, I noticed the Climate Room didn't quickly point to how the month compared to normal. So I added a widget which now displays this.
- Severe weather event summary maps. As soon as we launched the site, storms arrived. We want to be able to remember how much damage they produced for any date, and these interactive maps will help.


